Riverbed SteelCentral Web Analyzer
Web and cloud-based application monitoring
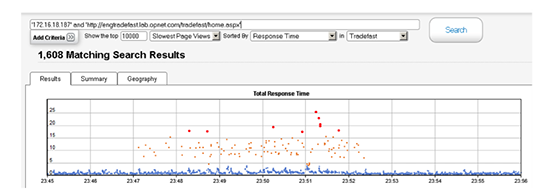
Find the worst-performing web transactions.
Formerly Known As: OPNET AppResponse Xpert BrowserMetrix
Sorry, this product is no longer available, please contact us for a replacement.
Click here to jump to more pricing!
Overview:
Business Challenge
With the complex nature of modern applications, monitoring end-user experience is critical to understanding the quality of application delivery and the health of the business. If it falls short of providing the complete picture, unhappy users and lost revenue can be the result.
SteelCentral Web Analyzer delivers end- user experience (EUE) monitoring for web applications, including cloud environments and mobile users. JavaScript instrumentation provides visibility into real user experience across the Internet. Dashboards present detailed insight into end-to-end performance, response time composition, browser and platform type, and user location. SteelCentral Web Analyzer is available as a monthly, pay- as-you-go SaaS subscription as well as an on-premise solution.
The Riverbed Solution
Riverbed SteelCentral Web Analyzer delivers end-user experience (EUE) monitoring for web applications, including cloud environments and mobile users. JavaScript instrumentation provides visibility into real user experience across the Internet. Dashboards present detailed insight into end-to-end performance, response time composition, browser and platform type, and user location. Web Analyzer is available as a monthly, pay-as-you-go SaaS subscription as well as an on-premise solution.
SteelCentral Web Analyzer includes the following capabilities:
- Records actual user activity and end-to-end performance.
- Uses quick-and-easy-to-deploy lightweight JavaScript instrumentation.
- Reports on key performance metrics, including end-to-end response time, response time composition, page view statistics, and Apdex, which is an industry standard for measuring user satisfaction for an application.
- Measures performance by application, page, user, geographic location, and browser and platform type, including the individual records with extensive detail for each page view.
- Stores and analyzes performance and forensic data on a highly scalable, high-availability SaaS platform, eliminating the need for host servers.
- Generates alerts for performance threshold violations.
- Records all web transactions 24/7 for forensic analysis and troubleshooting.
- Delivers powerful, highly optimized search capabilities across all transactions to quickly pinpoint and analyze any transaction.
- Delineates response time by contributing sources including server delay, network delay, browser render time, redirect time, DNS lookup delay, and more.
- Provides web-based GUI to enable users to access and analyze real-time and historical performance data from anywhere.
- Supports any JavaScript-enabled browser including browsers on mobile devices.
- Monthly subscription price based on the number of views for monitored pages.
- Support for recording Ajax GET and POST calls and transactions.
Key Benefits:
- Monitor end-user experience for web applications and mobile apps with minimal instrumentation and zero footprint in the IT environment.
- Accelerate triage and troubleshooting of application performance problems.
- Restore visibility into end-user experience for applications hosted in the public cloud.
- Extend end-user experience monitoring to all users, wherever they are located.
- Understand impact of web page and mobile app performance on end-user satisfaction.
- Understand how web page performance varies by browsers, devices, and platforms.
- Eliminate “finger-pointing” among IT teams about the source of application performance problems.
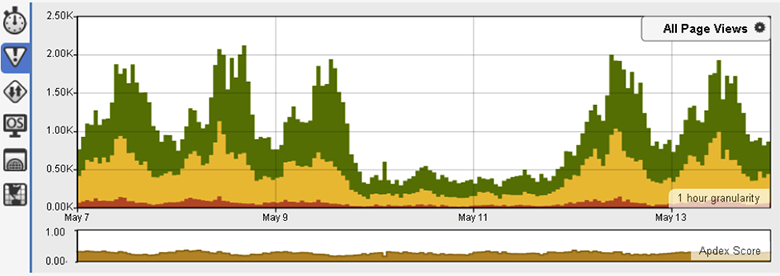
Visualize page view information and Apdex scores.
Key Capabilities:
Web Analyzer end-user experience monitoring
Web Analyzer end-user experience monitoring shows the users that are having application performance problems. It captures browsers page view performance data from and stores and indexes it for search and analysis. It enables end-user experience for all types of enterprise applications to provide early identification of issues and quickly determine the scope and seriousness of the problem.
The Web Analyzer easy-to-use, high-level heat map dashboards graphically display where in the world users are experiencing performance problems on a color-coded heat map. From there, it’s possible for operations teams to drill down to identify the user or users who are having performance problems and the user transactions where the problem is occurring – without manual instrumentation or performance degradation.
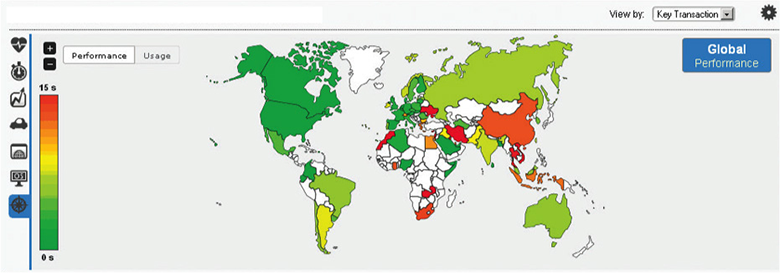
Visualize end-user experience by geographic location.
Key end-user experience monitoring features
- Provides support for Internet Explorer, Firefox, Chrome, and Opera browsers.
- Provides support for native iOS and Android mobile apps.
- Provides production-oriented dashboard heat maps that show color-coded mappings of who is experiencing application performance problems.
- Supports all end-users using a web browser, regardless of user location or device – laptop, tablet, or mobile device.
- Reports key end-user experience metrics including Apdex, end-to-end response time, detailed response time composition, and page view statistics.
- Shows response time by contributing sources including server delay, network delay, browser render time, redirect time, DNS lookup delay, connection setup, in-browser layout, and resource loading times.
- Provides detailed performance reporting by application, page, user, geographic location, browser and device or platform type.
- Provides application recognition, user identification, root-cause analysis, and powerful business-level context through dashboard analytics.
- Supports automatic JavaScript injection through the AppInternals agent or Riverbed Stingray Traffic Manager application delivery controller software.
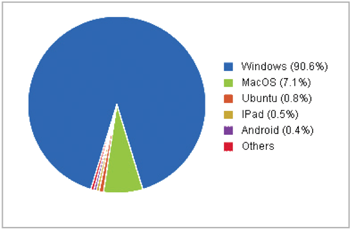
Profile users by platform type.
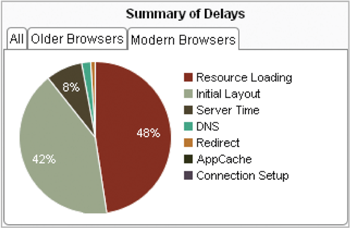
Break down application response time into contributing sources of delay.
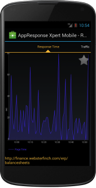
Native mobile app monitoring
Web Analyzer provides support for native mobile app monitoring for iOS and Android devices using an extensible, open source SDK (MAITI) library. Application operations teams can simultaneously monitor end-user experience for both mobile web and native mobile app users.
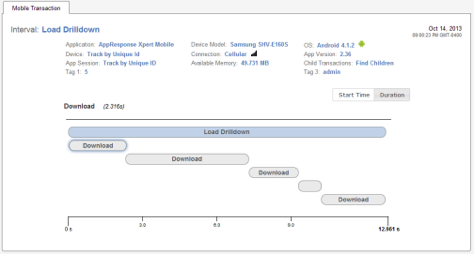
The waterfall chart shows load times of mobile app transaction performance with diagnostic information.
AJAX support
Web Analyzer provides monitoring support for AJAX (Asynchronous JavaScript and XML) that enables monitoring of transactions that use AJAX GET and POST commands for information exchange with a web server. Web Analyzer monitors and displays the xmlhttp.responseText string results so that app teams can determine if the correct information is being returned from a web server using AJAX.
Documentation:
Download the Riverbed SteelCentral Web Analyzer Datasheet (.PDF)
- Pricing and product availability subject to change without notice.