Riverbed SteelCentral NetSensor
Infrastructure Component Monitoring

SteelCentral NetSensor monitors server, network device and interface availability and performance indicators, such as bandwidth utilization,
packet loss, latency, errors, discards, CPU, and memory for SNMP and WMI-enabled devices.
Formerly Known As: OPNET AppSensor Xpert
Sorry, this product is no longer available, please contact us for a replacement.
Click here to jump to more pricing!
Overview:
Business Challenge
The health of the infrastructure components supporting your business-critical applications is just as important as those applications, because if the infrastructure fails, your applications fail, too. You need to be one step ahead with real-time, actionable information to identify and diagnose problems before your business is impacted. Are you trying to identify infrastructure component problems without having to deploy costly agents everywhere? Do you need a better way to know if your sites, applications, and devices go down during off hours? Can you tell which path an application actually took?
The Riverbed Solution
Riverbed SteelCentral NetSensor software provides agentless infrastructure component monitoring to deliver a comprehensive picture of how your infrastructure is affecting network and application performance. It offers a broad overview of how the devices on your network are performing to complement your network and application performance management visibility.
SteelCentral NetSensor uses remote instrumentation interfaces such as Simple Network Management Protocol (SNMP) and Windows Management Instrumentation (WMI) to capture availability and performance information from infrastructure components, including servers, application components, network devices, and vendor-specific management systems. It monitors network device and interface availability and performance indicators, such as bandwidth utilization, packet loss, latency, errors, discards, CPU, and memory for SNMP and WMI-enabled devices.
It also supports synthetic transaction monitoring, allowing you to collect performance data from scheduled tests that simulate the way users interact with your critical sites, applications and devices. Synthetic monitoring using distributed test engines allows you to proactively test availability and performance of your applications remotely.
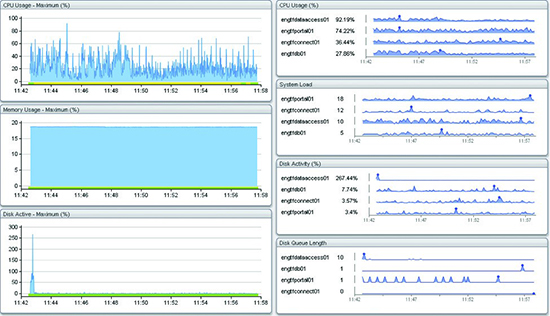
SteelCentral NetSensor software supplies its data, on both a historical and real-time basis, to the Riverbed Performance Management Dashboard.
Key Benefits
- Accelerate application troubleshooting by understanding the role of infrastructure in performance issues
- Monitor service, application and server response time, availability and end-to-end performance 24/7 — even during off hours
- Track availability and uptime of routers, switches, and other SNMP- and WMI-enabled devices
- Understand the impact and measure service level agreements (SLA) for third-party services
- Test B2B web services that use SOAP, REST or other web service technologies
- Complement high-level application and network performance management workflows with element performance and availability data
Key Features:
Low-overhead data collection
- Agentless data collection minimizes overhead
- Automatically discovers and monitors infrastructure components
- Supports SNMP, WMI, and synthetic monitoring in a single solution
Synthetic monitoring
- Supports Web transactions (using Selenium), HTTP, databases, DNS, TCP Port, Ping, and external scripts
- Test results include status, availability, response time, and test failure reason
- Utilizes light-weight distributed test engines to provide perspective throughout the enterprise
Path analysis
- Patented AppNetwork path discovery and tracing technology discovers the network devices (Layer 2/3) on the application’s path and obtains their performance metrics to aid in network path analysis
- Leverages Cisco IP Service Level Agreement (IP SLA) and Juniper Real-time Performance Monitoring (SteelCentral) data to proactively monitor application infrastructure
Alerting
- Set custom alerts for key devices in your application infrastructure
- View alerts by email, Syslog, SNMP trap, and RSS feed
Integration with Riverbed products
- Displays test results in the Riverbed Performance Management Dashboard to provide single-pane-of-glass viewing with other Riverbed application and network performance management solutions
- Provides Riverbed SteelCentral AppResponse appliance with server and network element metrics to investigate infrastructure-related causes of poor responsiveness
- Supplies Riverbed SteelCentral AppMapper software with detailed information about application components and relationships
- Supports running synthetic test engines on Riverbed SteelHead EX appliances TM
Supported Synthetic Tests
- Web transactions
- HTTP
- Databases
- DNS
- TCP port
- Ping
- External scripts
How it Works:
SNMP and WMI polling
- Any device that supports SNMP and WMI metrics can be polled, including routers, switches, servers, and hosts. Simply specify which devices to poll, which metrics to collect, and the frequency to collect them
- The automatic discovery process and “add device” wizard makes it easy to add devices for polling
Synthetic monitoring
- Utilize light-weight distributed test engines to provide perspective throughout the enterprise
- Simply specify which tests to run, at what frequency, and from which test engines.
- Supported synthetic tests include Web transactions (using Selenium), HTTP, databases, DNS, TCP port, Ping, and external scripts
Documentation:
Download the Riverbed SteelCentral NetSensor Datasheet (.PDF)
- Pricing and product availability subject to change without notice.
