Riverbed SteelCentral AppResponse 2000v
Real-time application performance monitoring based on actual end-user experience
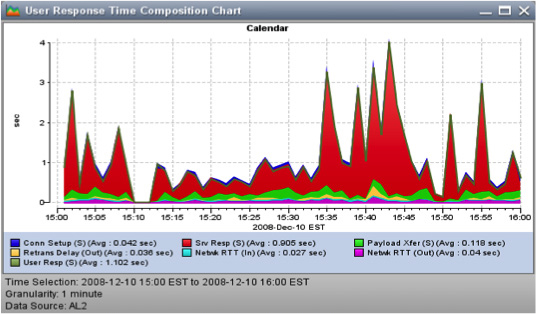
Riverbed AppResponse automatically calculates a breakdown of user response time into network and server
delay so you can quickly determine where the problem is occurring.
Formerly Known As: OPNET AppResponse
Sorry, this product is no longer available, please contact us for a replacement.
Click here to jump to more pricing!
Overview:
Business Challenge
Problems can happen anywhere — at the end user device, on the network, or across application infrastructures and networks. IT operations staff often know there’s a problem but can’t get to the right level of analysis quickly or easily enough. Frequently, expert staff must be taken off key projects in order to troubleshoot the issue.
IT operations teams need a performance management solution that provides visibility across the entire application delivery environment. They need intelligence into the end-user experience, application transactions, and network performance to quickly diagnose root cause before the enterprise is impacted.
The Riverbed Solution
Riverbed AppResponse joins together advanced application and transaction insight, comprehensive end-user experience monitoring, and deep network intelligence into a single appliance to provide total visibility into your application performance problems.
It helps you discover where and when bottlenecks are occurring so that you can troubleshoot problems faster, and it streamlines workflows and reporting to enable cross-team collaboration and put an end to finger pointing.
Use it to gain actionable insights to monitor and improve business-critical application performance and make users happy.
AppResponse passively monitors the network and collects packet, application, and transaction data for continuous monitoring and fast troubleshooting. Using high-speed packet acquisition and multi-stage analytic processing, it delivers powerful capabilities, such as automatic application discovery and rich application insights, end-user experience monitoring for web and non-web applications, and response time decomposition.
Moreover, it delivers real-time and historical application transaction analytics, VoIP and video quality monitoring, and deep network intelligence.
Key Benefits
Minimize Downtime
- Rapidly identify and triage problems
- Detect emerging performance issues before users are materially impacted
- Ensure performance of web-based business transactions
Improve It Productivity
- Enable operational consistency
- Reduce “finger pointing” among IT teams
- Proactively manage usage and performance trends
Reduce Costs
- Protect user experience and minimize impact of downtime on business
- Reduce risks and avoid costs through strategic planning
- Reduce tool complexity
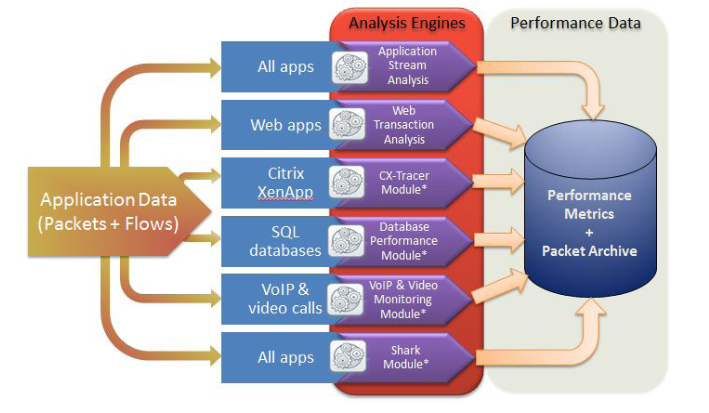
Add-on Modules:
A variety of optional modules provide specialized analysis capabilities, including:
Deep network intelligence
AppResponse Shark module adds rich network intelligence to supplement the existing enduser experience monitoring and transaction analysis provided by Riverbed AppResponse. It speeds troubleshooting with streamlined workflows and deeper network insight, letting you get to the right level of information needed to solve problems quickly and easily
Per-user Citrix transaction analysis
CX-Tracer module provides unprecedented end-to-end visibility into Citrix XenApp user transactions, enabling you to quickly pinpoint the root cause of Citrix performance problems. CX-Tracer automatically correlates front-end user sessions to their back-end counterparts, enabling end-to-end analysis of individual Citrix XenApp user sessions to quickly determine why performance is slow and whether the problem originates with the client, network, server, or application.
Database transaction analysis
Database performance module identifies the impact of the database on end-to-end application performance. By monitoring database performance at the transaction level, you can identify the particular SQL statement or database call responsible for application delay and equip yourdatabase team with actionable information. Its agentless approach introduces zero overhead on database operationand does not require privileged access to database systems or database diagnostics logging.
VoIP and video quality monitoring
Unified communications module monitors and reports on live VoIP and video call quality, enabling you to proactively manage the performance and user experience for a broad range of VoIP and video services for enterprise and call center environments. Proactively resolve communication issues by monitoring IP voice, video, and data traffic side-by-side to determine how application services are being delivered and compete for common resources.
Key Features:
End-user experience monitoring
- Monitor end-user experience for all users, all applications, all the time
- Geographic heat map displays end-user experience for Web apps and page views
- Its agent-less approach introduces zero overhead
- Break down application response time into contributing sources of delay
- Monitor and analyze performance of web applications at the page level
Support for large- scale deployments
- Supports up to one million connections through an intelligent and scale-as-you-grow performance architecture
- Improves ROI by increasing throughput and number of connections in a single box by 50 percent
Application visibility
- Automatically discover applications
- Track performance by application, user, transactions, business division, and location
- Measure performance of VoIP calls while they are in progress, including Microsoft Lync VoIP
- Monitor and troubleshoot high- definition video quality, such as Cisco TelePresence, Cisco Tandberg, and Polycom telepresence systems
Transaction analysis
- Report web application performance for all individual transactions
- Trace user transactions over Citrix XenApp servers for end-to-end visibility
- Monitor performance of database transactions, pinpointing specific SQL statements responsible for application delays
- Supports Oracle, SQL Server, DB2/UDB, Teradata, Sybase ASE, and Informix databases
Network analysis
- Network traffic monitoring
- Troubleshoot DNS and network-layer issues
- Troubleshoot quality of service (QoS) issues and DHCP
- Monitor microburst activity and alert with microsecond granularity
- Support for IPv6
Web console
- Out-of-the-box Quick Views
- Flexible, user-defined, custom views
Miscellaneous
- One-minute resolution for aggregated performance statistics is more precise than the typical 5- and 15-minute collection intervals
- Stores performance and forensic data in large capacity, long-term storage for sub-sequent troubleshooting, trending, and capacity planning
- Alert against SLA violations using dynamic thresholds that automatically adjust limits based on historical performance
- Seamlessly drill down from dashboards to details for fast root cause analysis
- Export flow data to Riverbed Cascade Profiler for end-to-end network monitoring, troubleshooting and reporting
Deployment and customization
- Flexible deployment options include both hardware and virtual appliances
- Diverse family of appliances supports a broad range of
- throughput and storage requirements
- Virtual appliances restore visibility of traffic between virtual machines within a server
- Dashboards and reports are easily customizable to provide application- specific, intuitive screens and workflows adapted to your needs
Project Integration:
- Cascade Profiler application-aware network management solution provides enterprise-wide reporting and analysis, combining data from Cascade Gateway, Cascade Shark, SteelHead, and Riverbed AppResponse appliances, as well as virtual solutions into a single, integrated view.
- Cascade Pilot packet analysis software uses an intuitive, graphical user interface to help you work faster by rapidly isolating the specific packets needed to diagnose and troubleshoot complex performance issues. It enables you to quickly analyze multi-terabyte packet recordings on remote Riverbed AppResponse appliances without having to transfer large packet capture files across the network. Because Cascade Pilot uses indexing to speed analysis, it can quickly dissect large trace files to focus on specific transactions for multi-tier user transaction analysis and performance prediction in Riverbed AppTransaction.
- Riverbed AppTransaction oftware provides detailed analysis of multi-tier application transactions. Using code-level and network-level forensic data from Riverbed AppResponse and other sources, it builds a detailed transaction model for root-case analysis and predictive studies.
- Riverbed AppMapper software automatically discovers application and infrastructure relationships to create a runtime application dependency map. It leverages the instrumentation from Riverbed AppResponse and other Riverbed solutions to build a comprehensive model of the application ecosystem.
- Riverbed AppResponse BrowserMetrix software utilizes JavaScript instrumentation to measure actual end-user experience for web applications.
- Riverbed AppSensor software provides broad infrastructure monitoring for a more complete picture of the application’s operating environment. It uses remote instrumentation interfaces to capture performance information from servers, application components, the application delivery network, and vendor-specific management systems.
- Riverbed AppInternals software traces user transactions through the application and provides deep monitoring for the individual components.
Specifications:
| Riverbed SteelCentral AppResponse Solutions Model Specifications | |||||||
|---|---|---|---|---|---|---|---|
| Model | 1200 | 2200 | 3300 | 3800 | 4300 | 5100 | 6000 |
| Disk Capacity1 | 3 TB | 3 TB | 6 TB | 16 TB | 29TB; Expandable to 173TB | 42TB; Expanable to 186TB | 48TB; Expandable to 264TB |
| Solid State Drive | N/A | 4x 480G | |||||
| Expansion Chassis | N/A | Up to two Expansion Chassis 300 for a total of 173TB | Up to two Expansion Chassis 300 for a total of 186TB | Up to three Expansion Chassis 300 for a total of 264TB | |||
| Operating System | Customized FreeBSD | ||||||
| Serial Port | DB-9M | RJ-45 | DB-9M | ||||
| SVGA Video Port | DB-15F | ||||||
| SAS Port | N/A | Single mini SAS SFF-8088 connector | Dual mini SAS SFF-8088 connector | ||||
| RAM (GB) | 8 GB | 32GB | 64 GB | ||||
| Avaliable Traffice Monitoring/Capture Ports | 3 x 1G (SFP) + 1G (Copper 10/100/1000) | 4 x 1G (SFP) (Available in any combination of copper or fiber SFP modules) | 2 x 10G (SFP+) (SR and LR optics available) | ||||
| Management Port RJ45 Gigabit Ethernet (Copper) | 1 | ||||||
1 Raw Disk Capacity does not not take into account disk formatting, RAID overhead, software installation, or OS usage
| Power And Physical Specifications | |||||||
|---|---|---|---|---|---|---|---|
| Model | 1200 | 2200 | 3300 | 3800 | 4300 | 5100 | 6000 |
| Power Supplies | 1x350W2 | 2 x 750W (redundant) | 2 x 960W (redundant) | 4 x 420W (3+1 redundant) | |||
| Power [Watts] (Typical) | 90 | 200 | 300 | 500 | 660 | ||
| BTU [per hour] (Typical) | 300 | 690 | 1100 | 1700 | 2300 | ||
| Line Power Requirement | 110-240 VAC, 50-60 Hz, 3-1.5 A | 110-240 VAC, 50-60 Hz, 6-3 A | 110-240 VAC, 50-60 Hz, 9-4 A | 110-240 VAC, 50-60 Hz, 11-6 A | |||
| Operating Temperature | Preferred: +10 C to +30 C (+50 F to +86 F) Max: +10 C to +35 C (+50 F to +95 F) |
||||||
| Temperature (Non-Operating) |
-40 C to +70 C (-40 F to +158 F) | ||||||
| Humidity (Non-operating) |
90% @ 35 C (95 F), non-condensing |
90% @ 28º C (82.4º F) non-condensing | |||||
| Rack Size 19” (RU) | 1 | 2 | 4 | 5 | |||
| System Dimensions (actual) | 1.67” H x 17.25” W x 22” D, 4.24cm H x 44cm W x 56cm D” |
3.44” H x 17” W x 28” D, 8.7cm H x 44cm W x 72cm D |
6.9”H X 17”W X 26” D, 17.5cm H X 44cm W X 66cm D |
8.75” H x 17” W x 26” D ,22.2cm H x 44cm W x 66cm D |
|||
| Packaging Dimensions (in shipping carton) |
12” H x 25” W x 36” D, 31cm H x 64cm W x 92cm D |
12” H x 25” W x 36” D, 31cm H x 64cm W x 92cm D |
27”H X 27”W X 40” D, 69cm H X 69cm W X 102cm D |
35” H x 27” W x 40” D, 89cm H x 69cm W x 102cm D |
|||
| Weight (actual) | 22 lbs, 10 kgs | 48 lbs, 22 kgs | 83 lbs, 38 kgs | 130 lbs, 59 kgs | |||
| Weight (with packaging) | 33 lbs, 15 kgs | 65 lbs, 30 kgs | 129 lbs, 59 kgs | 195 lbs, 89 kgs | |||
| Rail Information | Included in base appliance package | ||||||
2 Hotswap not available
| Model Specifications SteelCentral AppResponse Solutions | ||
|---|---|---|
| Model | Director 300 | Expansion Chassis 300 |
| Disk Capacity1 | 4 TB | 72 TB |
| Traffic Ports | N/A | N/A |
| Management Port | RJ45 Gigabit Ethernet (Copper) | N/A |
| Serial Port | RJ45 | N/A |
| SVGA Video Port | DB-15F | N/A |
| SAS Port | N/A | Dual Mini SAS SFF-8088 connectors |
| RAM (GB) | 16 GB | N/A |
| Power And Physical Specifications SteelCentral AppResponse Solutions | ||
|---|---|---|
| Model | Director 300 | Expansion Chassis 300 |
| Power Supply | 2 x 750W (Redundant) | 4 x 420W (3 + 1 redundant) |
| Power [Watts] (Typical) | 200 | 450 |
| BTU [per hour] (Typical) | 690 | 1,550 |
| Line Power Requirement | 110-240 VAC, 50-60Hz,6-3 A | 110-240 VAC, 50-60hz, 11-6A |
| Max Temperature (Operating) | Preferred: +10 C to +30 C (+50 F to +86 F) Max: +10 C to +35 C (+50 F to +95 F) |
|
| Temperature (Non-operating) | -40 C to +70 C (-40 F to +158 F) | -20 C to +70 C (-4 F to +158 F) |
| Humidity (Non-operating) | 90% @ 28 C (82.4 F) non condensing | |
| Rack Size 19” (RU) | 2 | 5 |
| System Dimensions (actual) | 3.44” H x 17” W x 28” D, 8.7cm H x 44cm W x 72cm D |
8.7” H x 17” W x 26” D, 12.2cm H x 44cm W x 66cm D |
| Packaging Dimensions (in shipping carton) |
12” H x 25” W x 36” D, 31cm H x 64cm W x 92cm D |
35”H X 27”W X 40”D, 89cm H X 69cm W X 102cm D |
| Weight (actual) | 48 lbs, 22 kgs | 122 lbs, 56 kgs |
| Weight (in shipping carton) | 65 lbs, 30 kg | 178 lbs, 81 kgs |
| Rail Information | Included | Included |
| Model Specifications SteelCentral AppResponse Virtual Solutions | |||||
|---|---|---|---|---|---|
| Rover3 | Vmon4 | v20004 | |||
| Model | Small | Big | Small | Big | |
| Packet Storage | 19 or 98 GB | 19 GB | 98 GB | 19 GB | 98 GB |
| Hypervisor | VMware Workstation 9 (or newer) | VMware ESX and ESXi versions 4 and newer | VMware ESX and ESXi versions 4 and newer | VMware ESX and ESXi versions 4 and newer | VMware ESX and ESXi versions 4 and newer |
| vCPU | 1 | 1 | 1 | 1 | 1 |
| RAM | 4 GB (min) | 4 GB (min) | 4 GB (min) | 4 GB (min) | 4 GB (min) |
| System Disk Space | 60 GB or 260 GB | 60 GB | 260 GB | 60 GB | -260 GB |
| Capture Ports | 2 x vNICs | 4 x vNICs | 4 x vNIC | 4 x vNIC | 4 x vNIC |
| Management Ports | 1 (uses VM mgmt port) | 1 (uses VM mgmt port) | 1 (uses VM mgmt port) | 1 (uses VM mgmt port) | 1 (uses VM mgmt port) |
3 Any platform that supports VMware Workstation 9.0.2 or higher. The host system must be 64-bit. 4 Intel’s VT-x or AMD’s AMD-V virtualization technology is required. VT must be enabled in BIOS in addition to being supported on the processor.
Documentation:
Download the Riverbed SteelCentral Performance Management Brochure (.PDF)
Download the Riverbed SteelCentral AppResponse Spec Sheet (.PDF)
Download the Riverbed SteelCentral AppResponse Datasheet (.PDF)
- Pricing and product availability subject to change without notice.