Riverbed SteelCentral AppInternals
Big Data-driven Application Performance Management

Formerly Known As: OPNET AppInternals software
Sorry, this product is no longer available, please contact us for a replacement.
Click here to jump to more pricing!
Overview:
Business Challenge
See application performance through your users’ eyes
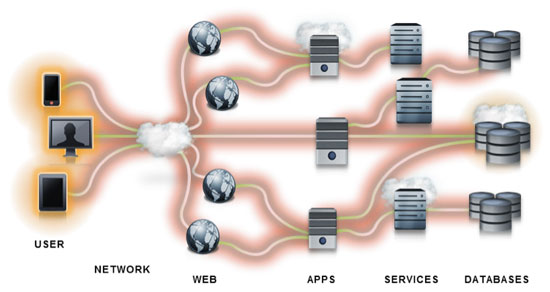
Modern applications often span dozens of virtual and physical servers located in many tiers to complete a single transaction. Along the way they make use of third-party and/or cloud services, and initiate multiple database lookups. Troubleshooting performance problems is difficult and coordinating troubleshooting efforts between application support and development teams makes it even more challenging.
Monitoring end-user experience is critical to understanding the quality of application delivery and understanding the health of the business. To ensure fast problem diagnosis, end-user experience should be integrated with code-level transaction tracing, deep application component monitoring, and powerful analytics to provide the complete picture.
The Riverbed Solution
Riverbed SteelCentral AppInternals is comprehensive APM designed for production environments and provides deep visibility into the performance of complex, multi-tier applications. It provides applications teams with a complete picture of what they need to quickly and collaboratively identify, troubleshoot, and debug application performance issues. It monitors all transactions from the browser to back-end databases by combining code-level transaction tracing and end-user experience monitoring, fine-grained application component monitoring, and big data-driven performance analytics.
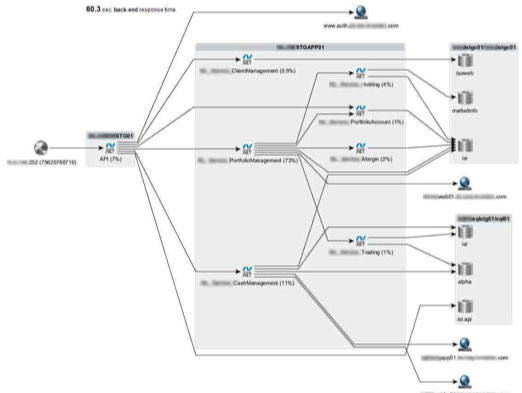
AppInternals enables application teams to understand and manage real user experience from the browser click through the web- and application-tiers, to the database, and back for all users and all transactions, 24x7. It does this by using lightweight JavaScript agents that monitor real user experience from the browser, and through advanced, low-overhead, always on transaction tracing to provide always on transaction tracing for deep visibility into application code as it executes. This generates a complete picture of a transaction’s path and its performance across each tier for immediate and historical analysis.
AppInternals excels at monitoring custom Java and .NET applications and also enables monitoring of hundreds of third party and custom applications, including popular commercial offerings such as SharePoint, Oracle E-Business, and others.
AppInternals includes the following capabilities:
- Measures end-to-end transaction times for applications and web pages and provides immediate notification of performance changes
- Identifies where problem delays occur – browser, network, server, database, or application
- Traces every transaction through the back end and stores it for real-time and historical analysis
- Enables seamless drill down into specific transactions (service, line of code)
- Correlates multiple metrics to identify causal relationships
Key Benefits
- Minimize application downtime
- Detect application performance problems earlier using real end-user experience metrics
- Accelerate troubleshooting by rapidly pinpointing root cause down to the code level
- Ensure transaction performance and SLA compliance
- Dramatically improve efficiency and collaboration between application support and development teams
Key Features:
Big Data Analytics Provides Precise Answers
AppInternals big data analytics enables application support and developer teams to evaluate multi-tiered user transaction performance across all application tiers to understand the impact of systems on transaction performance. It records and indexes all transaction traces—not just samples—in its Transaction Trace Warehouse big data store.
With every transaction captured, application teams always have the critical data they need at hand. It’s simple, powerful open-ended search speeds troubleshooting by making it fast and easy to find a single transaction among billions. AppInternals includes a big data-powered correlation engine that automates troubleshooting by identifying cause-and-effect relationships between hundreds of thousands of performance metrics across multiple application tiers. Patented big data analytics automatically identify unusual patterns for thousands of performance indicators, enabling proactive performance management.

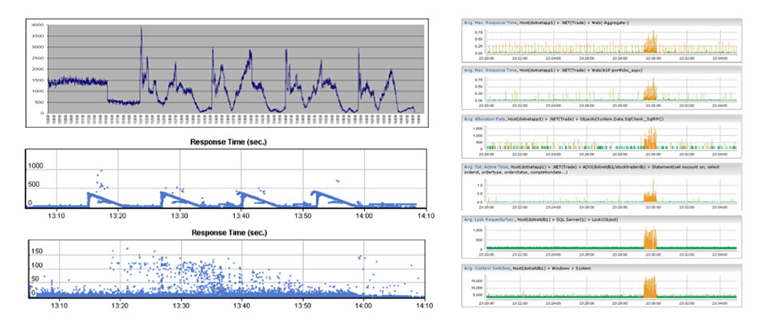
AppInternals collects thousands of metrics every second from all tiers of the application. These measurements are fed into a powerful analytics engine, where they are analyzed and correlated to produce dashboards and in-depth data views based on events and behavior patterns.
Complete application lifecycle support
AppInternals supports application performance management for the entire application lifecycle. It provides versatile features that are valuable for production, development and test/QA including information exchange between teams to support agile development, continuous integration and continuous delivery.
AppInternals light-weight sensor agents enable “always-on” transaction tracing and scaling across 1000’s of servers. Application support teams can use AppInternals in production to identify issues early and rapidly remediate performance problems. Seamless drill down from the transaction trace to the effected code enables product teams to highlight the problematic calls, methods, or services for developers.
AppInternals also integrates with popular integrated development environments (IDEs), including Microsoft Visual Studio and Eclipse, enabling bidirectional drill down to streamline application debugging and troubleshooting. It also opens up visibility and enhances collaboration across application operations and development teams.
Developers and QA teams can analyze applications in the test to proactively identify performance bottlenecks and prevent potential issues by seeing how code changes impact application performance before releasing the applications to production.
Key AppInternals Use Cases
Use AppInternals to:
- Troubleshoot application performance for any application– webbased or extensible packaged applications – or how they are deployed – data center, or private, public, or hybrid cloud
- Streamline testing and deployment of new application releases
- Monitor transaction performance and SLA compliance
- Detect and document SaaS or third-party application and service problems
- Communicate relevant application performance information across business, app support , test and development stakeholders
Key Capabilities:
Complete application lifecycle support
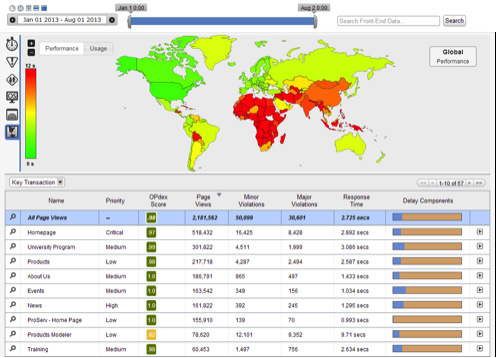
AppInternals end user experience monitoring shows who is having application performance problems. It captures page view performance data from client browsers and stores and indexes it for search and analysis. It enables end- user experience for all types of enterprise applications to provide early identification of issues and quickly determine the scope and seriousness of the problem. Complete application lifecycle support
It’s easy to use high level heat map dashboards to graphically display where in the world users are experiencing performance problems on a color-coded heat map. From there it’s possible for operations teams to drill down to identify the user or users that are having a performance problem and into the user transactions where the problem is occurring. Application topologies are automatically discovered and mapped without the need of application code or configuration changes.
- Measures “stopwatch” times for applications and web pages and provides immediate notification of performance changes
- Identifies where problem delays occur – browser, network, server, database, or application
- Traces every transaction through the back end and stores it for real-time and historical analysis
- Enables seamless drill down into specific transactions (service, line of code)
- Correlates multiple metrics to identify causal relationships

AppInternals displays front-end user experience metrics in the same view as back-end transaction-level information to accelerate problem identification and resolution.
Complete application lifecycle support
AppInternals Big Data Analytics identifies everywhere an application performance problem exists. It stores the code-level transaction trace information gathered by agents deployed within instrumented application servers and stores it in its big data store. It captures all transaction data. Transaction information is never sampled. It provides a variety of ways to streamline problem identification and resolution by uncovering hidden patterns, unknown correlations and other useful information.
- Captures, stores, and indexes all transactions using a big data approach that scales to billions of transactions
- Always-on cross-tier transaction tracing follows user transactions through all application components with code-level detail
- Patented deviation analysis automatically learns normal behavior for thousands of performance indicators and alerts on deviations
- True correlation engine automatically identifies cause-and-effect relationships across hundreds of thousands of performance metrics from across multiple application tiers to find relationships and automate troubleshooting
- Identifies metrics that deviate at the same instance in time
- Identifies metrics that repeatedly deviate in tandem over time
- Simple and powerful open-ended search makes finding that one transaction in a billion quick and easy so that troubleshooting can begin sooner
- Heuristic-based recommendations are offered in “plain English” to simplify diagnosis
- Bidirectional integration with Microsoft Visual Studio and Eclipse integrated development environments (IDE) enhances workflow between support and development teams

AppInternals big data analytics finds the root cause and all problems associated with the root cause.
End to End Transaction Tracing with deep application component monitoring
AppInternals end-to-end transaction tracing identifies what an application performance problem is. It provides code-level visibility into every user transaction and displays a complete map of transactions passing through Java JVM or .NET CLR physical and virtual servers.
- Monitor thousands of performance metrics from across all application tiers, including Java, .NET, database, VMware, and SOA
- Automatic application discovery and intelligent tuning accelerates set up and ensures low overhead End to End Transaction Tracing with deep application component monitoring
- Low-overhead, always-on memory analysis and real-time memory leak detection identifies the code-level source of leaks
- Automatically detect systemic anomalies
- Correlate relationships among performance metrics to support troubleshooting
- High resolution (~1 second) data capture and storagefor system and environment metrics

AppInternals provides fine-grained monitoring of resources consumed by the application components and events occurring within them.
Extensive metric collection
AppInternals provides deep visibility into J2EE and.NET applications, with broad visibility across all other components. It collects thousands of measurements every second, including:
AppInternals
- Java/J2EE, WebSphere, WebLogic, JBoss, Tomcat, TomEE, Glassfish, etc.
- NET: IIS, ASP.NET
- Web services: REST, SOAP, XML-RPC
- VMware: VMware ESX, vSphere
- Web server: Apache, IIS
- Databases: Oracle, MS SQL Server, DB2
- Operating systems: Windows, Solaris, AIX, HP-UX, Linux
BrowserMetrx
- Browser: Internet Explorer, Firefox, Chrome, Opera
- Mobile Apps: iOS, Android
Documentation:
Download the Riverbed SteelCentral AppInternals Datasheet (.PDF)
- Pricing and product availability subject to change without notice.
